Milking Curve by Group Graph
The milk curve by group presents the milking efficiency per milking group for all the valid cows milked with that group.
Note: Valid milking groups are groups with more than 15 valid cows; valid cows are only cows with AMT for first attachment ≥ 2.6min
To open the Milking Curve graph
Click the Graph drop-down arrow, then select Milk Curve Graph (Group).
A legend for each group is displayed:
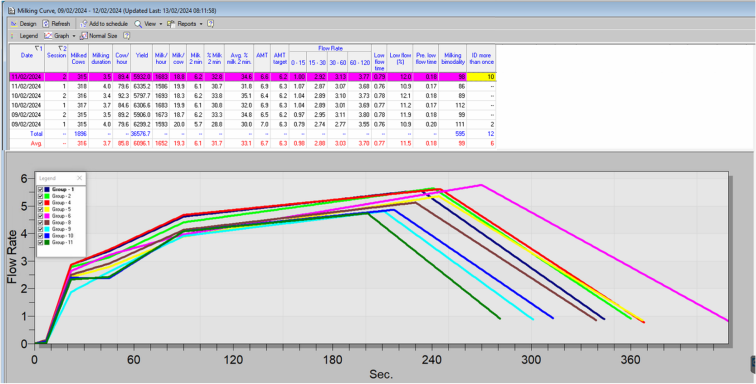
The Milking Curve report displays the following data:
|
Indicator |
Description |
|
|---|---|---|
|
Date |
Date for data. By default, data is displayed for the last 24 hours, but it may be extracted also for longer periods. |
|
|
Session |
Milking session 1= morning Milking session 2 = noon Milking session 3 = evening/night |
|
|
Milked Cows |
The number of cows milked during the session (identified and unidentified cows). |
|
|
Milking duration |
The time between the last detachment (with milk>1kg) to the first attachment (with milk >1kg). |
|
|
Cow/hour |
Total number of milked cows divided by the Milking duration. |
|
|
Yield |
Total herd yield. |
|
|
Milk/hour |
The average milk yield per hour. |
|
|
Milk/cow |
The average milk yield per cow for the session. |
|
|
Milk 2 min |
Milk produced in the first 2 minutes. |
|
|
% Milk 2 min. |
Displays the percentage of milk harvested in the first 2 minutes, out of the total milk yield. Note: This header provides data only for those cows with a yield >4 kg and without a second attachment. *Target value:45%. |
|
|
Avg % milk 2 min. |
Displays the percentage of milk harvested in the first 2 minutes, out of the total milk yield. Note: This header provides data for all milked cows, including those with a second attachment. |
|
|
AMT |
Displays the Actual Milking Time (from attachment to cluster removal). *Target value: less or equal to Target AMT. |
|
|
AMT Target |
Displays the calculated highest expected milking time (claw-on time) according to the farms milk production. |
|
|
Flow Rate |
0-15 |
Flow rate (kg/minute) for the first 15 seconds of milking. |
|
15-30 |
Flow rate (kg/minute) between 15-30 seconds of milking. |
|
|
30-60 |
Flow rate (kg/minute) between 30-60 seconds of milking. |
|
|
60-120 |
Flow rate (kg/minute) for the second minute of milking. |
|
|
Low Flow Time |
Total time the cows were milked at a low flow rate (<1kg/2.2lbs per minute. Sum of Pre-low flow time and Low flow time at removal). *Target value: less than 1 minute. |
|
|
Low Flow % |
Percent of time the cows were milked at a low flow rate (<1kg/2.2lbs per minute). *Target value: less than 20%. |
|
|
Pre-low flow time |
Time from Start Milking, until flow reached 1kg/2.2lbs per minute. Long Pre-low flow time is an indication of poor preparation of cows for milking. |
|
|
Milking bimodality |
Displays the number of milked cows that meet the bimodality threshold. |
|
|
ID more than once |
Cows identified multiple times in the parlor during a specific session. |
|
*Target values differ between herds milked 3 times/day and 2 times/day. The target values presented are for herds milked 3 times/day.